
Let the User Edit: How a Static Dashboard Became a Full-Stack Platform (and What Broke Along the Way)
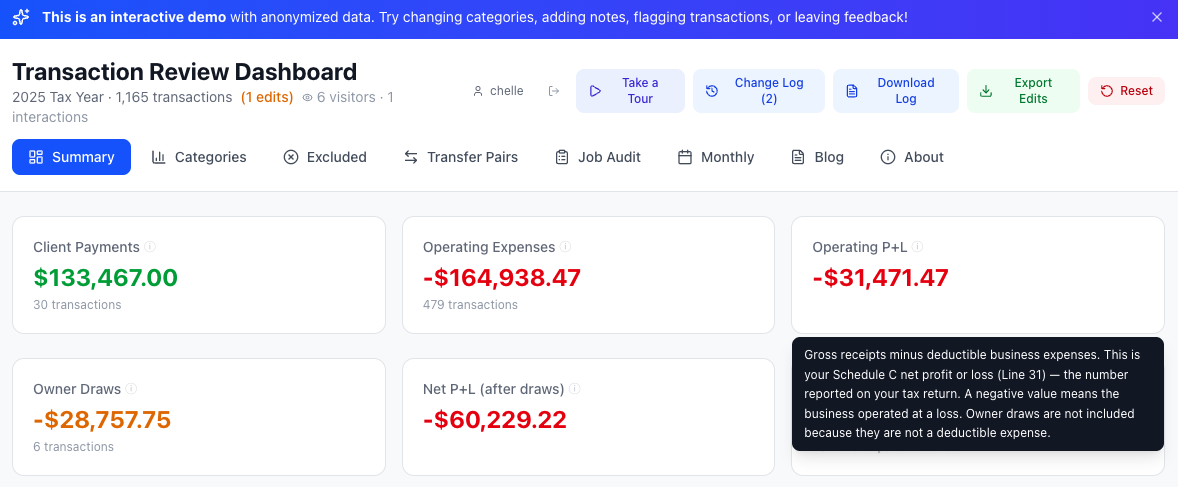
Not just numbers: every metric links back to IRS Schedule C line items, so the business owner knows exactly what they're looking at. Six stat cards, two rows, one tax story — from gross receipts to net P+L after owner draws.
Published March 17, 2026
This is Part 2 of the project story. Part 1 covers the initial pipeline and dashboard build. This post covers what happened next — the decision to make it interactive, the bugs that surfaced, the domain lessons, the architecture decisions, and the systems I built to make the whole thing sustainable.
The demo runs on the same architecture described here — serverless backend, real-time sync, analytics — with anonymized sample data. You can edit transactions, leave feedback, and see the system respond in real time.
A Dashboard You Can Only Look At
The first version of this project did exactly what it was supposed to: ingest transactions from 11 accounts, categorize them, and give Eric a clean dashboard to review before tax time. It worked. He used it.
But "review" is the key word. The initial dashboard was essentially read-only — a viewer for the pipeline's output. Eric could look at his transactions, drill into categories, see transfer pairs and monthly totals. If something was wrong, his only option was to tell me, and I'd fix it in the pipeline and redeploy. That feedback loop was slow, lossy, and dependent on us being in the same room or on a call.
The Decision to Let Users Edit
I realized pretty quickly that the dashboard needed to be more than a report. Eric knows his business better than any rules engine I could write. He knows that a $300 ATM withdrawal was cash for a contractor. He knows that a Venmo payment to a friend isn't a business expense. He knows when Turner Lumber gave him a discount and when a check double-counted an invoice.
That knowledge was trapped in Eric's head. The dashboard needed a way to capture it.
So I added interactivity: category editing via dropdowns, inline notes on any transaction, flag-for-review toggles, a general feedback box on every page, and a full change log with per-entry undo. Every action was attributed to the signed-in user and persisted in localStorage.
This was the decision that changed the entire trajectory of the project. A read-only dashboard is simple. An interactive one introduces state, identity, persistence, conflict resolution, and — as I was about to learn — an entirely new class of bugs.
What Broke When a Real User Touched the Data
The Bulk-Edit Bug
The most dramatic issue: 846 out of 1,310 transactions had no unique ID in their source data. Bank CSVs and credit card exports simply don't include transaction IDs. I hadn't noticed because the dashboard appeared to work — until Eric changed one transaction's category and watched hundreds of others change with it.
The root cause was a shared empty-string key in the edit storage. One edit propagated to every transaction that shared that key. Eric's changelog ballooned to 863 entries, 846 of which were ghosts created by the bug.
The fix was straightforward — generate synthetic unique IDs at load time — but the discovery process was the real lesson. Eric reported "a bunch of transactions changed" and "numbers don't look right." It took a full audit of his changelog, cross-referenced against the transaction data, to identify that 17 of his 863 entries were real edits and the rest were artifacts.
The Sign Convention Problem
Eric flagged several Turner Lumber transactions as "needs review" with a note: "It's reading the line item DISCOUNT and thinking it's a material. But if it could instead register it as a refund and add it as its own positive line item."
Turner Lumber gives Eric early-pay discounts — about 5% off his invoices. My PDF parser read the discount as a negative amount and categorized it as a material expense. But a discount isn't money Eric spent. It's money he didn't spend. The sign was wrong.
Same issue with credit memos (returns and adjustments). Sixteen transactions, $742 in total, all with the wrong sign. A one-line fix in the pipeline (abs(raw_amount) instead of raw_amount), but it required understanding Turner Lumber's invoicing model — knowledge that only came from Eric's feedback.
The Double-Counting Check
Eric also flagged a $810 check payment as "already accounted for." Turner Lumber operates as a store credit account: Eric buys materials on account, gets monthly statements, and pays by check. Both the individual invoices and the check payment were in the dataset — double-counting.
This is a pattern that repeats across all three store credit accounts (Turner Lumber, Walker's True Value, Home Depot). Invoices are the real expense; payments against the balance are transfers. Getting this wrong means inflating expenses by the full payment amount.
From Edits to Pipeline: The Feedback Loop
Eric's 17 valid edits weren't just corrections — they were domain knowledge that needed to be encoded permanently into the pipeline. Not patched in the dashboard with localStorage overrides, but baked into the categorization rules so they'd work correctly on the next run.
I built a formal process for this:
- Pull Eric's edits from the server — a Python script downloads his changelog, feedback, and categorization changes
- Separate valid edits from noise — filter out bug artifacts, identify real corrections
- Update pipeline rules — add regex patterns, Venmo counterparty rules, or transaction-level overrides
- Regenerate the data — re-run the full pipeline end-to-end
- Reset the dashboard — bump the version so stale localStorage edits clear automatically
- Update documentation — every change gets logged in the changelog, knowledge base, and project plan
This isn't ad hoc. It's a documented workflow with specific steps, specific files to update, and explicit rules about what requires human review versus what can be automated. The documentation itself is part of the system — not an afterthought.
The Communication Problem
Here's something I didn't think about during Phase 1: how do I talk to Eric through the tool?
Eric isn't going to read a GitHub commit message. He's not going to check Slack. He opens the dashboard, looks at his numbers, and moves on. If I need to tell him what changed, explain why his old edits were cleared, or ask him domain-specific questions about his business — I need to do it inside the dashboard.
So I built three features:
- A welcome modal — a one-time popup explaining what changed in each deploy, in plain language. Tied to the version number so it only shows once per update.
- A Messages tab — a permanent place where Eric can re-read my updates and reply. His replies sync to the server. I pull them with a script.
- An Open Questions tab — I publish specific questions I need Eric to answer (about categorization rules, business patterns, edge cases). He replies one-by-one. His answers sync to the server and feed back into the documentation.
This means I can iterate on the pipeline, deploy updates, and communicate changes — all without scheduling a call or sending an email. Eric engages at his own pace.
Server-Side Architecture
The original dashboard stored everything in the browser's localStorage. That was fine for a prototype, but it meant Eric's edits were trapped on his device. If he cleared his browser, everything was gone. And I had no way to see what he'd done without asking him to manually export a JSON file.
The solution: Netlify Functions (serverless) + Netlify Blobs (key-value storage). Zero cost, zero infrastructure to manage.
- Edit sync — every change Eric makes debounce-syncs to the server within 3 seconds. On page load, the dashboard checks the server for state. If localStorage is empty (e.g., after a version reset) but the server has data, the server state loads automatically.
- One-command admin pull — a Python script downloads everything: edits, changelog, feedback, message replies, question answers. It separates them into actionable buckets and prints a summary.
- Version-aware resets — when I bump the version to clear stale data, the dashboard also clears the server state so old edits don't reload.
For the public demo version, I extended this pattern with analytics tracking (visitor sessions, feature usage, email signups) and per-visitor edit persistence — each anonymous visitor gets their own server-side storage keyed to a persistent browser ID.
Documentation as Infrastructure
Every project has documentation. Most of it goes stale after the first week. I decided to treat documentation as infrastructure — something that has to be maintained with the same discipline as code.
The project maintains:
- A knowledge base — everything I've learned about Eric's business, his accounts, his vendors, tax rules, and edge cases. This is the single source of truth for domain knowledge.
- A changelog — every change to the pipeline, dashboard, or documentation, with dates, descriptions, and impact analysis (including dollar amounts).
- A project plan — phased with clear status tracking. Completed items are marked done. Next steps are explicit.
- A future changes document — known issues, planned improvements, and their priority. Items get marked complete as they ship.
- Questions for Eric — specific, answerable questions about his business that I need to resolve. Answers get processed into the knowledge base.
The rule is simple: every code change requires a documentation update in the same commit. Not as a follow-up. Not as a separate PR. In the same commit.
This isn't bureaucracy — it's how I avoid losing context. When I come back to this project in six months, the knowledge base tells me exactly how Turner Lumber's store credit works, why CHECK #56 is classified as a transfer, and what Bryon Bullock's Venmo payments actually represent. Without that documentation, I'd have to re-derive it all from the raw data and Eric's memory.
The Workflow
I codified the entire edit-review process as a repeatable workflow:
- Pull Eric's latest edits and feedback from the server
- Separate valid corrections from noise
- For each valid edit: update the appropriate pipeline script, add tests, regenerate data
- Update all documentation (changelog, knowledge base, questions, future changes, project plan)
- Deploy with a version bump
- Write a welcome message explaining what changed
Every step has specific file paths, specific rules, and specific outputs. A new developer could pick up this workflow and run it without asking me a single question. That's the goal.
What's Next
The pipeline currently handles one tax year of data. The architecture is designed to scale:
- Stable transaction IDs — replacing synthetic IDs with deterministic hashes so edits survive data regeneration
- Multi-year support — running the same pipeline across multiple tax years with consistent rules
- Visual credit/refund indicators — so positive amounts in expense categories are immediately recognizable as refunds, not data errors
- Expanded store credit handling — generalizing the Turner Lumber pattern to any vendor that operates on invoice-and-pay cycles
The bigger picture: this isn't just a tax tool. It's a pattern for building custom data automation for small businesses — the ones that fall between "spreadsheet" and "enterprise software." Too complex for off-the-shelf, too small for a six-figure consulting engagement. That's where I work.
The demo runs on the same architecture described here — serverless backend, real-time sync, analytics — with anonymized sample data. You can edit transactions, leave feedback, and see the system respond in real time.
Interested in a custom solution for your business? I'd love to chat.
Built with Python, pandas, React 19, Vite, TailwindCSS 4, Recharts, Netlify Functions, and Netlify Blobs. Source on GitHub.