
How I Automated Tax Prep for a Small Construction Business
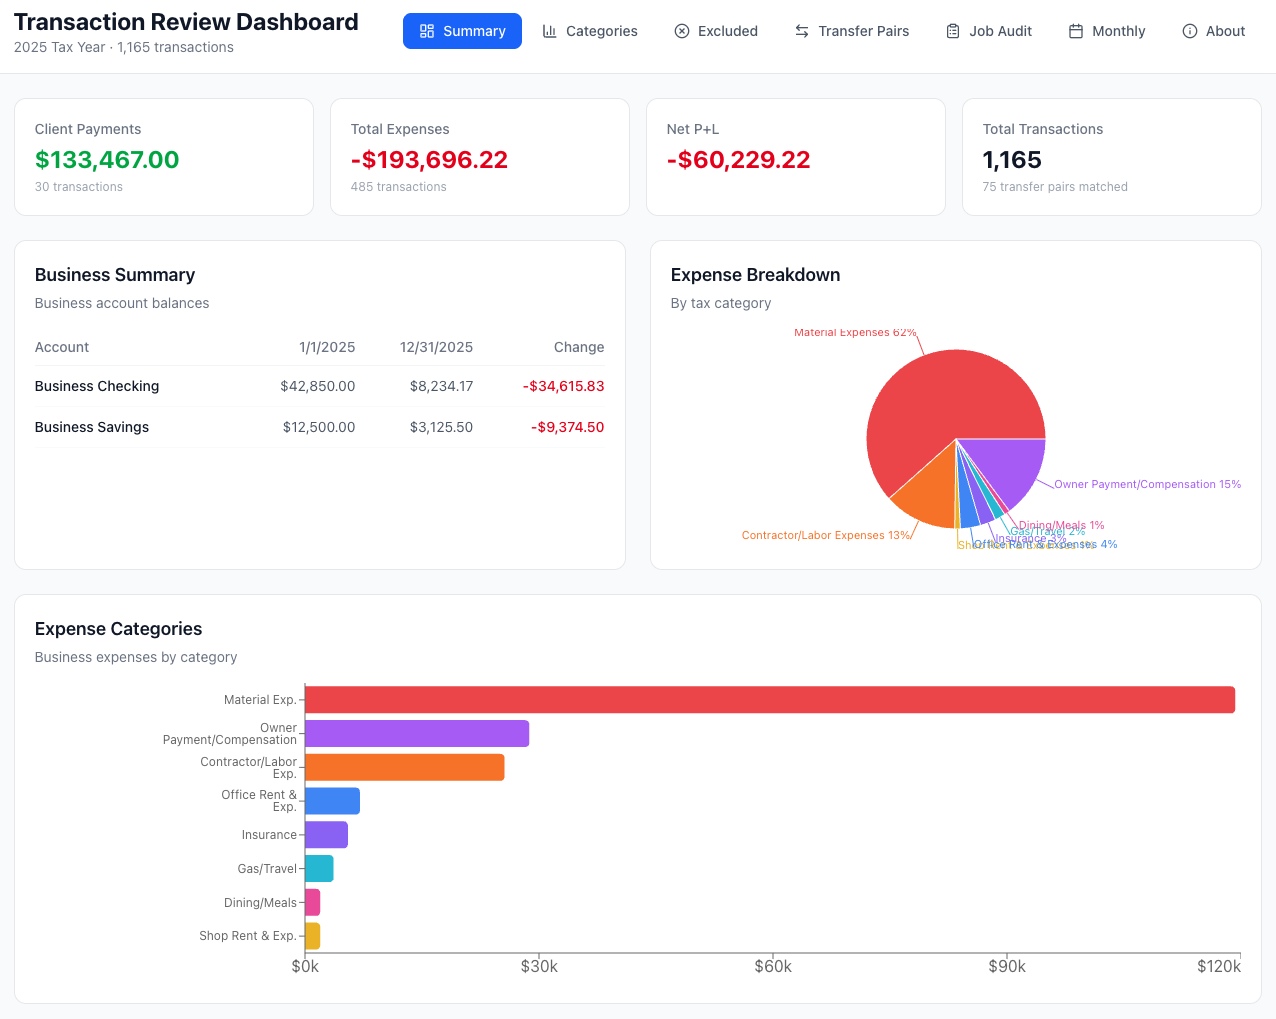
Image of the sample dashboard deliverable (scroll down to visit the actual demo dashboard)
Published March 4, 2026
📌 Update: This post covers Phase 1 of the project — the data pipeline and initial dashboard. Since then, this project went through a major second phase that added a serverless backend, real-time analytics, a developer-to-client communication layer, and a documentation-driven workflow. If you're evaluating my technical work, I'd recommend reading both posts to see how a real project evolves through iteration and user feedback.
My fiancé Eric runs a one-man construction company in Moab, Utah. Every year around tax time, he faces the same nightmare: pulling together transactions from eleven different accounts — business checking, savings, two credit cards, a Home Depot card, Venmo, and store credit accounts at the local hardware store and lumber yard — and figuring out what's a business expense, what's personal, and what's actually income.
He's tried the off-the-shelf tools. QuickBooks, FreshBooks, Wave — they were either too expensive for a solo operator, too bloated with features he'd never use, or just didn't do the one thing he actually needed without also making him manage invoicing, payroll, CRM, and a dozen other things he wasn't looking for. He never found anything that quite fit, at least not easily enough to be worth the friction. So he'd fall back to spreadsheets. Every year.
The Problem
Eric's clients love paying through Venmo. His contractors expect Venmo too. The issue? When a client sends $5,000 for a kitchen remodel and Eric transfers that money to his business checking account, the bank sees two positive transactions — the Venmo payment and the checking deposit. Without careful tracking, it looks like $10,000 of income instead of $5,000. Multiply that across a year of projects and you're looking at a tax bill for money you never made.
On top of that, Eric writes checks to his lumber yard, pays invoices at the hardware store on a store credit account, and has recurring insurance and utility payments scattered across multiple accounts. His accountant needs a clean summary by category — materials, contractor labor, insurance, overhead, gas — and Eric was doing all of this manually in a spreadsheet.
The Solution
I built a three-stage Python pipeline that processes everything automatically.
Stage 1: Unify. A processing script ingests CSVs from the banks, parses HTML statements from the hardware store, and extracts text from PDF statements from the lumber yard using pdftotext. Every transaction gets normalized into a single format — same columns, same date format, same sign convention. The script also detects inter-account transfers and pairs them, so that $5,000 moving from Venmo to checking is flagged as one transfer, not two income events. 1,310 transactions across 11 accounts, unified in seconds.
Stage 2: Categorize. A rules engine automatically assigns each transaction to a tax category. It uses regex pattern matching on descriptions (TURNER LUMBER → materials, MAVERIK → gas), Venmo-specific rules that match counterparty names with payment notes (Anthony Tomassetti + "Framing help" → contractor labor), and account-level defaults as a fallback. The result: 100% of transactions categorized with zero manual intervention.
Stage 3: Report. A summary script aggregates everything into the exact format Eric's accountant expects — client payments, material expenses, contractor labor, shop overhead, office overhead, insurance, gas, owner draws, and net P&L. It also tracks the opening and closing balances of the business accounts.
The Dashboard
To make it easy for Eric to review everything before sending it to his accountant, I built an interactive React dashboard with seven views:
- Summary — High-level KPIs, account balances, expense charts, and a full category table
- Categories — Drill into any tax category and see every transaction, with full-text search
- Excluded — Review everything marked personal or as a transfer, to make sure nothing was missed
- Transfer Pairs — Every matched debit ↔ credit pair across accounts, sorted chronologically
- Job Audit — Per-project expense breakdowns derived from PO codes and Venmo payment notes, with expandable category details and charts — the beginning of automating the grueling project audit spreadsheets Eric used to maintain by hand
- Monthly — Income vs. expenses by month with expandable per-category breakdowns and transaction lists
No spreadsheet skills required — just click and scroll.
The whole pipeline runs in under 10 seconds. What used to take Eric days of manual spreadsheet work now takes one command.
Try the demo with sample data → (Note: the live demo now reflects the Phase 2 upgrades — serverless backend, real-time sync, and analytics)
Interested in a custom solution for your business? I'd love to chat.
Built with Python, pandas, React, TailwindCSS, and Recharts. Source on GitHub.